


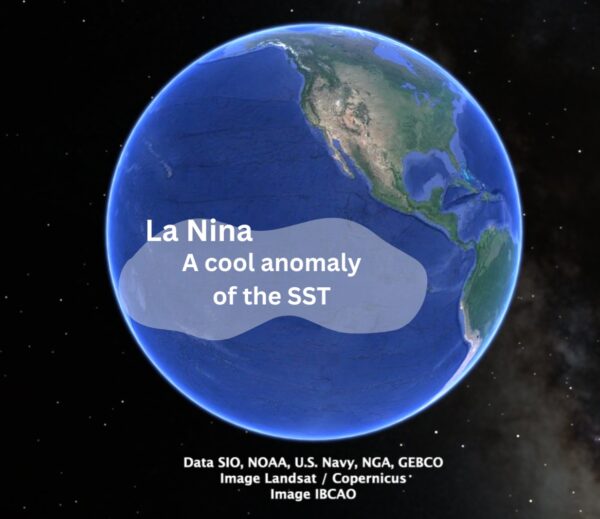
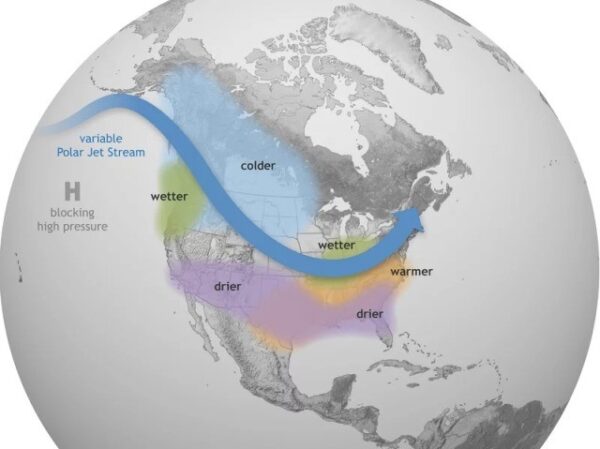
La Nina and El Nino
La Nina and El Nino are two opposing climate patterns based on temperature anomalies in the sea surface temperature (SST) of the Pacific Ocean.
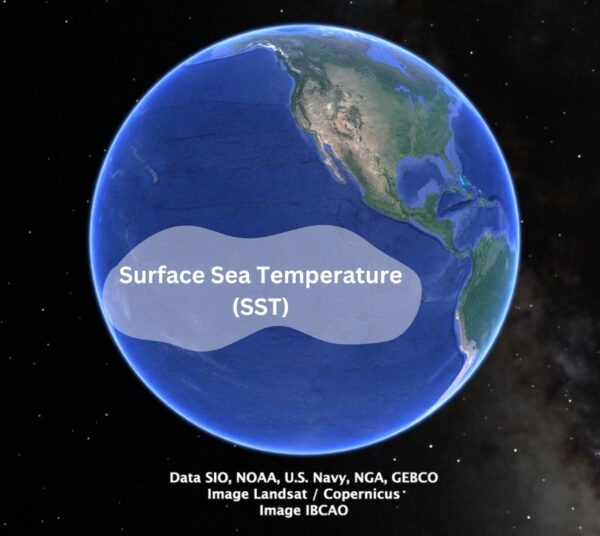
An anomaly is categorized as La Nina or El Nino when a 5-consecutive 3-month running mean of sea surface temperatures is above (+0.5°C) or below (-0.5°C) the threshold, respectively. This standard of measurement is known as the Oceanic Niño Index (ONI). These anomalies have a strong impact on climate.
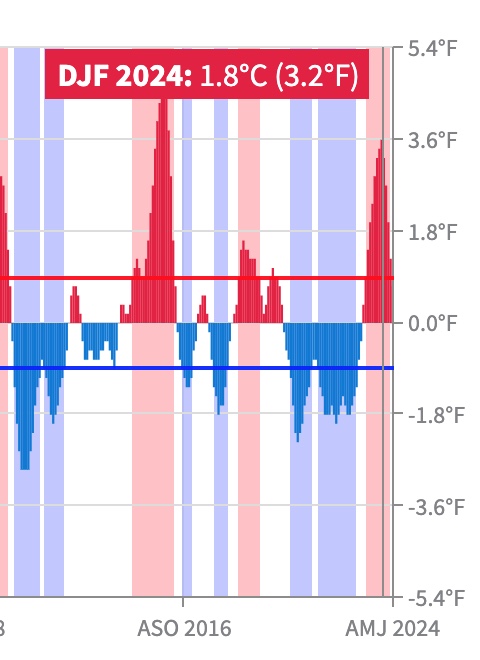
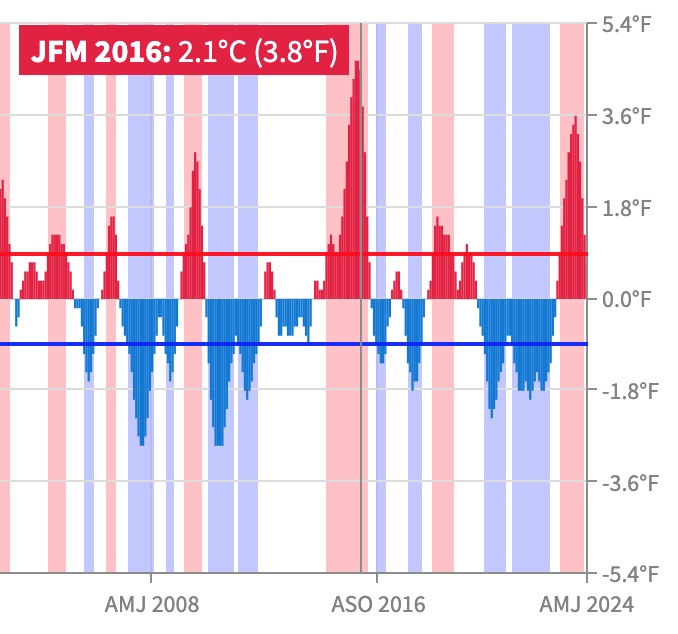
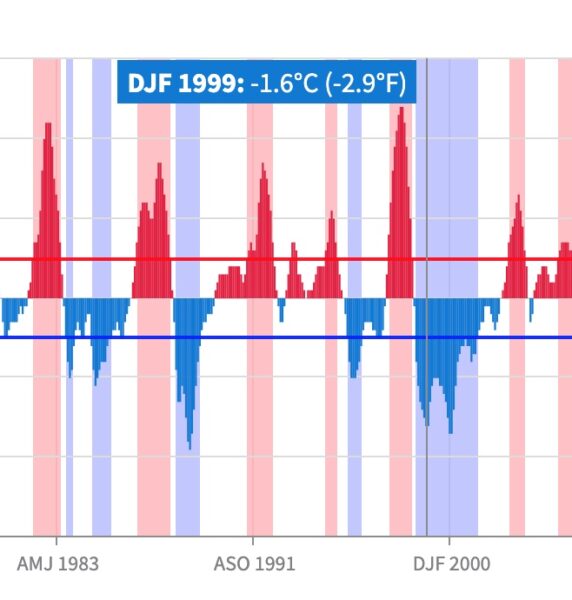
Oceanic Nino Index (ONI)
The Oceanic Nino Index (ONI) defines warm (red) and cold (blue) phases based on sea surface temperature (SST) anomalies in the Niño 3.4 region.
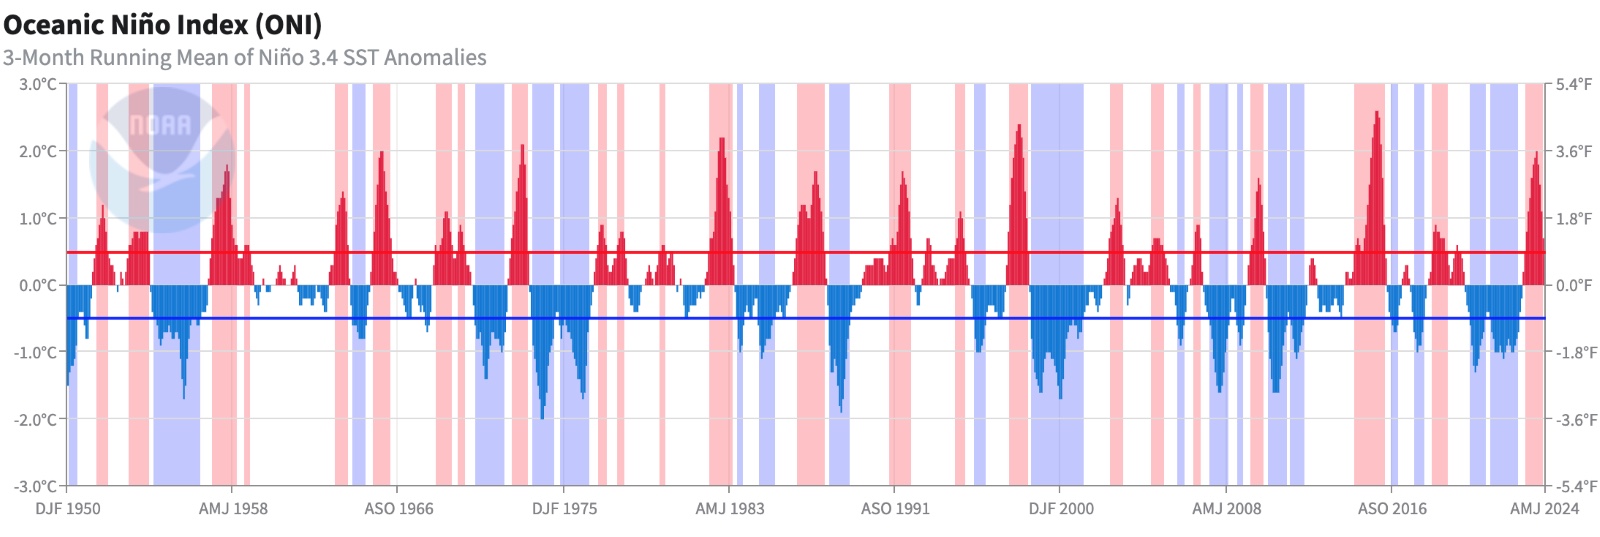
Source:https://www.cpc.ncep.noaa.gov/data/indices/oni.ascii.txt https://www.ncei.noaa.gov/access/monitoring/enso/sst
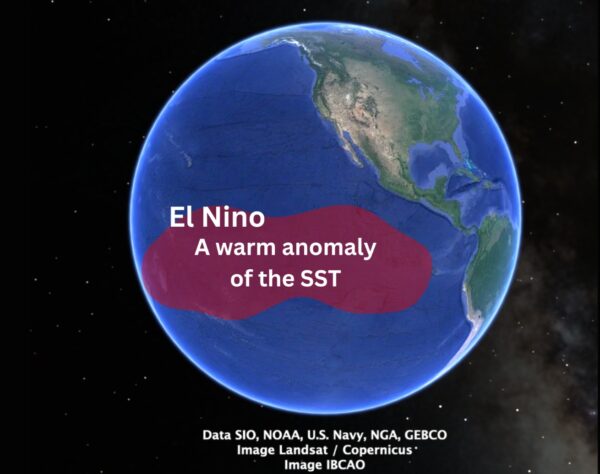
We can categorize the red warming anomalies as El Nino cycles and the blue cooling anomalies as La Nina cycles. The further the anomaly is from +0.5°C (for El Nino) or -0.5°C (for La Nina), the stronger the cycle.


Reader Interactions